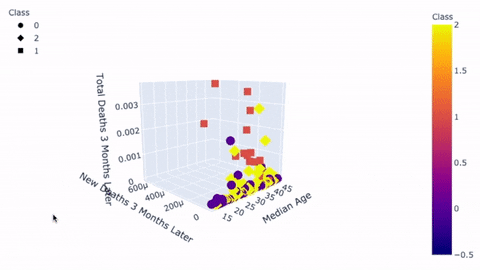
Introduction

On Sept. 22, 2020, the World Health Organization (WHO) reported 31,132,906 cases of COVID-19, including 962,008 deaths. In an article featured on June 8, 2020, The World Bank predicted a "5.2% contraction in global GDP in 2020... the deepest global recession in decades".

The societal burden of COVID-19 is clear and the world's future, from a standpoint of the economy and potential for future pandemics, is sobering.

This project had two goals:

(1) To create a machine learning (ML) model that predicts the number of total cases and deaths.
(2) To evaluate government responses and determine which measures resulted in better outcomes.

Data sources included the Oxford University Blavatnik School of Government, Our World In Data, and Google Community Mobility Reports.

Models and findings from this project could be adapted for use in future pandemics to predict numbers of cases and deaths and to inform government policies. Visit our GitHub repo for project details.
A supervised machine learning (ML) model was created to predict future counts of total cases and deaths. The model had a high overall coefficient of determination (>99%) for predictions 30 days into the future. However, the less data available for a country (i.e. dates with corresponding case and death counts), the poorer the accuracy for that country. Use the map below to compare predicted vs. actual counts of total deaths 30 days later (Aug. 31, 2020).

Feature Selection

Features were selected for the model based on the feature importances of a Random Forest Regressor model. The charts below show the feature importances (in percentages) for predicting the total number of cases and deaths with R-squared values of 0.98 and 1.00, respectively.
The human cost of COVID-19 is shown below.

View the numbers of new cases and new deaths for one country or compare numbers between countries.

Dates begin as early as January 1, 2020 and end on August 31, 2020.
To compare government responses between countries, Oxford University created an index ("government response index" (GR)) that rated government responses on a scale of 0 to 100. An index of zero meant no measures, whereas 100 meant that the most aggressive measures, relative to all countries, were employed.

The GR index was an aggregate of the indices stringency, health/containment, and economic support. These indices rated government responses by their respective categories (e.g. stringency), also on a scale of 0 to 100. Each index grouped similar government measures. For example, stringency (i.e. behavioural restrictions) included government measures such as "school closures" and "stay at home requirements".

Select the index to view the government measures that it evaluates, and to display its top 5 and bottom 5 countries.

Use the map to compare countries' scores for each index.

Choose The Index

Correlations Between Variables

Feature and target variables were investigated for correlations.
# Variable A Other Variables
1 High government response (specifically in stringency & health) - Decreased mobility outdoors, and increased staying at home
- Longer time from 1st case to max. number of new cases.
2 High economic support - High government response
- Higher median age
3 High avg. number of tests per day (adjusted for population) - High rate of increase of total tests
- Higher max. number of new cases
- Higher total cases and total deaths 3 months after the 1st case
4 High median age - Higher number of cases and deaths 3 months after the 1st case
5 High mobility outdoors - Low government response (mainly in stringency and health)
- Low max. number of new cases and new deaths
- (The reverse is true for high mobility in residential locations (staying at home))
6 Longer time from 1st case to max. number of new cases - Lower number of new and total cases at 3 months
#1

- Stringency measures are being enforced/obeyed
- Strict stringency and health measures increased the time to reach max. number of new cases but had no effect on decreasing the max. number of new cases. (Measures did not actually "flatten the curve".)

#2

The most proactive governments:
- Provide more economic support
- Belong to countries with older populations

#3

- Countries that test more frequently also have higher max. and total numbers of cases and deaths because they test more

#4

- Countries with older populations tend to have more cases and deaths. This is consistent with what is currently known - that COVID-related morbidity and mortality tend to affect older people.

#5

- Changes in mobility seem to be "reactive" to government measures and perhaps the media, which broadcasts case and death counts.

#6

- Increased time to reach max. number of new cases was associated with reduced numbers of cases and deaths 3 months later.


Country Classes

Unsupervised machine learning (ML) was used to group countries into 3 classes (Class 0, Class 1, and Class 2)
based on all variables.

Explore Country Locations

Lists of Countries By Class

Classes were compared to find differences in feature and target variables,
and a profile was created for each class.

For the plot below, "change" in mobility is shown, where a positive value means increased mobility "outside the home",
zero means no change from baseline, and a negative value means decreased mobility "outside the home".

Class 0 Class 1 Class 2
Country
Characteristics
- Lower government response
- Low mobility restrictions
- Higher government response
- Governments reacted before or around the time of the 1st case (results not shown)
- High avg. number of tests per day (results not shown)
- Lower mobility restrictions
- High median age
- Higher government response
- High mobility restrictions
Country
Outcomes
- Lower max. number of cases & deaths

3 months after the 1st case:
- Lower number of new cases & deaths (data not shown)
- Lower number of total cases & deaths
- Took less time to increase from 1st case to max. number of new cases & deaths

3 months after the 1st case:
- Higher number of new cases & deaths (results not shown)
- Higher number of total cases and deaths
- Higher number of max. new cases & deaths

3 months after the 1st case:
- Lower number of new cases & deaths (results not shown)
- Lower number of total cases & deaths
Class Interpretations
0 - Class 0 seemed to contain countries that were less affected by COVID as shown by lower overall numbers of cases and deaths. If this is true, then their lower government responses and more relaxed mobility restrictions were appropriate.
- An alternate explanation is that these countries were affected by COVID but their governments did not respond appropriately and tested less frequently. In this case, the lower numbers of cases and deaths resulted from scarcity of testing and did not represent these countries’ true situations. Further investigation is needed.
1 Class 1 countries had high government responses, their governments usually acted before the 1st case occurred, and they tested more frequently. However, because of the countries' older populations and their more relaxed mobility restrictions, these countries had higher counts of cases and deaths 3 months after their first case.
2 - Class 2 countries had high government responses and were strict with mobility restrictions. However, they showed higher max. numbers of new cases and deaths, and lower counts 3 months after their first case.
- A possible explanation is that these countries tested more frequently around the time of the max. number of cases and deaths, and less frequently later on. Further investigation is needed.

The Most Successful
Stringency & Health/Containment Measures

Stringency (S) and health/containment (H) measures were the only components of a government's response that had, at least, "low" correlation (correlation coefficient of 0.3 to less than 0.5) with an outcome - time (days) from the first case to the max. number of new cases.

The longer the time from the first case to the max. number of cases, the more a country was able to provide relief for its healthcare resources.

To determine what the most effective S & H measures were, countries were ranked by this outcome, and S & H measures between the top 10 and bottom 10 countries were compared.

Measures Top 10 Countries Bottom 10 Countries
School Closures Required closures at all levels (targeted) Required closures for some levels e.g. high school (general)
Workplace Closures Required closing (or work from home) for some sectors or categories of workers (general) Recommended closing (or work from home) (targeted)
Restrictions On Gathering Restrictions on gathering between 10-100 people (targeted) Restrictions on gatherings between 100-1000 people (targeted)
Public Transport Closures Recommended closing (or significantly reducing volume/route/means of transport available) (targeted) No measures (targeted)
Stay At Home Requirements Require not leaving the house with exceptions for daily exercise, grocery shopping, and "essential" trips (targeted) Recommend not leaving the house (targeted)
Measures Top 10 Countries Bottom 10 Countries
Public Information Campaigns Coordinated public information campaign (e.g. across traditional and social media) (general) Public officials urging caution about COVID-19 (general)
Investment In Vaccines 56 million USD more (4X more) ---
Emergency Investment In Healthcare 2.6 billion USD more (66X more) ---

Interpretation

The top 10 countries had stricter stringency measures, coordinated public information campaigns about COVID, and made larger emergency investments in healthcare and vaccine development.

The top and bottom countries for "time from first case to max. number of new cases" differ from the top and bottom countries if multiple outcomes are considered, such as:

1. time from first case to max. number of new cases
2. max. number of new cases (adjusted for population)
3. total cases 3 months after the first case
Outcome 1 Only All 3 Outcomes
Top 10 Countries 1. India
2. Indonesia
3. Croatia
4. Spain
5. Philippines
6. Japan
7. Australia
8. Vietname
9. Hungary
10. Argentina
1. Vietnam
2. Japan
3. Myanmar
4. India
5. Australia
6. Sri Lanka
7. Philippines
8. Indonesia
9. Togo
10. Uganda
Bottom 10 Countries 153. Luxembourg
154. Mauritius
155. Belarus
156. Latvia
157. Norway
158. Niger
159. Uruguay
160. Estonia
161. Brunei
162. Laos
153. Ecuador
154. Norway
155. Portugal
156. Austria
157. Estonia
158. Ireland
159. Switzerland
160. Djibouti
161. Iceland
162. Luxembourg

Stringency Index "Ramp Up" vs Total Cases / Deaths

Each country’s stringency “ramp up” period (the time it takes for each government to implement their most stringent policies - based on Stringency Index) was isolated.

Then each country’s 30-, 60-, 90-, and 120-day reported totals for both total cases and total deaths from the beginning of the ramp up period, as a percentage of population, was captured.

Lastly, the global average for both stringency ramp up as well as for total cases and total deaths was determined in order to compare a country’s efforts against the global average, as well as against other countries.
Analysis for Rate of Increase of Total Cases/Deaths
Investigated whether the (A) slope of the ramp up period, (B) slope of the total cases (or total deaths), together with the (C) length of the ramp up period, could be used to rank each country’s efforts at flattening the curb, ultimately providing an overall country ranking system and thus determining which country’s efforts were successful and which were not.
Ramp Up

Which countries were more/less successful at flattening the curve based on their initial stringency efforts?
Stringency Ramp Up Ranking
(A)+(C)
Overall Cases Ranking
(A)+(B=Cases)+(C)
Overall Deaths Ranking
(A)+(B=Deaths)+(C)
Overall Ranking
(A)+(B=Cases+Deaths)+(C)
Top 10 Countries 1. Jordan
2. Angola
3. Laos
4. Ecuador
5. Kyrgyzstan
6. Rwanda
7. Austria
8. Mexico
9. Ukraine
10. United Kingdom
1. Laos
2. Angola
3. Jordan
4. Rwanda
5. Uganda
6. Zimbabwe
7. Gambia
8. Eritrea
9. Chad
10. Mauritius
1. Laos
2. Angola
3. Jordan
4. Rwanda
5. Uganda
6. Zimbabwe
7. Eritrea
8. Cote d'Ivoire
9. Gambia
10. Guinea
1. Laos
2. Angola
3. Uganda
4. Rwanda
5. Jordan
6. Eritrea
7. Gambia
8. Zimbabwe
9. Sri Lanka
10. Chad
Bottom 10 Countries 153. Suriname
154. Japan
155. Mozambique
156. Malaysia
157. Oman
158. Iran
159. Venezuela
160. Australia
161. Guam
162. Malawi
153. Italy
154. Suriname
155. Iceland
156. Brazil
157. Oman
158. Singapore
159. Guam
160. Kuwait
161. Iran
162. Chile
153. Azerbaijan
154. Peru
155. El Salvador
156. Kuwait
157. Suriname
158. Brazil
159. Guam
160. Italy
161. Chile
162. Iran
153. El Salvador
154. Suriname
155. Iceland
156. Guam
157. Peru
158. Kuwait
159. Italy
160. Brazil
161. Iran
162. Chile
Findings
Is there any relationship between the timing and severity of each countries initial stringency efforts and their outcome of total cases and deaths as a percentage of population?
There is no correlation between the slope of the ramp up period and resulting total cases and deaths. However, when reviewing the results of the top and bottom ranked countries, those with a quicker/higher ramp up period showed more promising results regarding total cases and deaths versus those with longer/lower ramp up periods. There appears to be something behind the numbers that warrants further exploration.

Further avenues for analysis: group similar countries (ex. government structure, GDP, population sentiment towards government, social unrest, etc.) and compare the results of each country within each grouping with the hopes of providing a more equitable comparison.
Ramp Up Correlation

Supervised Machine Learning (ML)


(1) Future total cases and deaths due to COVID-19 can be predicted with a high overall coefficient of determination (if enough data is available).


Data Analysis


(2) Aggressive stringency (S) and health/containment (H) measures increased the time for countries to reach their max. number of cases.

(3) High median age was associated with worse outcomes.

(4) Stringency measures were being enforced and/or obeyed. (Changes in mobility seemed reactive to government measures.)

(5) Countries may have higher numbers of cases and deaths because they test more frequently, not because of ineffective governments.

(6) A group of 16 countries was identified that had a profile of high government responses, high median ages, and lower mobility restrictions, and that experienced worse outcomes.

(7) S and H measures that resulted in better outcomes included more aggressive school, workplace, and public transport closures, restrictions on gathering, and stay-at-home requirements; coordinated public information campaigns about COVID-19; and larger emergency investments in healthcare and vaccine development.